Identifying & creating sales Key Performance Indicators (KPI) for your team is like looking for the right diet: Everyone claims to have the greatest one! Setting up KPIs for your sales team is highly subjective, same than following the right diet, and has to rely on various metrics.
Instead of highlighting the “Top 5 best KPIs”, I will emphasize the different metrics your sales team can play with. Then you are free to determine the right KPI according to your strategic goals. In order to help you with some examples, common sales KPIs will be listed in Part 5.
The real question is what’s right for you? What sales metrics will help you achieve your company goals?
IDENTIFY THE RIGHT KPIS
Start with the big picture
What are your company-strategic goals? Revenue? Growth? Customer acquisition? Customer Retention? On average, businesses have a main objective with one or two second goals that provide context and support to the first one. In skyrocket growth startups, everyone in the company know by heart those goals which help them to work altogether in the same direction. Here an example of 1st and 2nd goals for a SaaS company:
- Main goal: Increase growth by X%
- Supporting goal: Increase Customer Acquisition 10% month over month

Go Deeper
To reach your objectives you have to break down them into more sales specific goals according to specific metrics. You need to find out which sales metrics will help you to measure & track step by step your main and second goals. What sales objectives will help your company reach their overall goals?
Sales Specific Goals
- Main sales goal: $ Monthly Sales
- Supporting sales goal(s): % growth month over month
Common Contextual Metrics to Determine Sales Goals
a. Average Sales Cycle Length
Represent the amount of time from your first contact with a prospect to closing the deal, averaged across all won deals.
STEP 1
Sum (#) of days from 1st contact to customer conversion for all deals = Total (#) of days for all sales
STEP 2
Total (#) of days for all sales combined / (#) of deals = (#) of days for Average Sales Cycle
b. Activity Per Rep
Activity Per Rep is the total number of tasks a sales rep completes in a certain time period.
Add (#) of activities completed for each rep for certain time period (daily) = Total (#) of Activities Per Rep (daily)
c. Average Follow up Attempts
Average Follow-up Attempts is a metric that refers to the average number of tasks your sales reps do to close a lead (Win or not).
Total (#) of Follow-up Attempts / Total (#) of Leads = Average (#) Follow-up Attempts Per Lead
d. Average Purchase Value
Average Purchase Value is the average amount spent (in a single transaction) for your product or service. APV can be calculated based on the value of the contract, annually, monthly, weekly or daily value depending on your business model and the length of contracts in average.
Total ($) Value of Orders / (#) Orders over a Defined Period = ($) Average Purchase Value
e. Lead Response Time
Lead Response Time is the average time a sales rep need to follow-up with a lead after it got identified as a lead (submitting a form, downloading an ebook, etc.). This metric get more meaningful if it is calculated by lead source since the warmer a lead is the more important it is to follow-up quickly.
STEP 1
Time/date of new contact – time/date of follow up = (#) of min/hrs/days to respond
STEP 2
Sum of (#) min/hrs/day to respond for all contacts / (#) contacts = Avg (#) of min/hrs/days to respond
More Contextual metrics
- Average deal size ($)
- Average sales cycle X days/weeks/months
- Cost of sales ($)
- Opportunity win rate (%)
KPI focus on Action
Use the goals and contextual metrics you have outlined in step 3 and spread targeted one to your team according to what they need to reach their goals. The best practice to determine which goals and metrics can be leveraged is to go backward.
First determine how many leads you need to reach your target. Based on that, how many opportunities should be in your funnel? How many calls/emails/meetings are required? How many leads the marketing department needs to generate according to that number? Keep drilling down until you have a deep understanding of the key tasks driving your revenue.
Funnel flow:
- (#) of wins
- (#) of deals/opportunities
- (#) of sales qualified leads
- (#) of marketing qualified leads
- Funnel Volume vs Goals
Funnel Volume vs Goal compares the number of leads in your sales pipeline to targeted goal (number of leads required to realize the quota). It’s a complex KPI consist of a mix of sales metrics – one for each stage of your sales funnel.
STEP 1
Determine each level in your sales funnel.
Here the 3 most common stages:
Marketing Qualified Lead (MQL)
Marketing Qualified Leads (MQL), are individuals who have shown a higher interest than other leads, but are not enough ready to fully commit.
Sales Qualified Lead (SQL)
Sales Qualified Leads (SQLs), are individuals that your sales team has recognized as ready for a direct sales follow up.
Closed Deals
Closed deal represent the final stage in the sale funnel and is hitted when the sales rep close the deal with a customer.
STEP 2
Calculate the conversion rate between each level.
(#) of SQLs / (#) of MQLs = (#) MQL-SQL Conversion Rate
- SQL-Close Conversion Rate:
(#) of Deals Closed / (#) of SQL = (#) Close Conversion Rate
STEP 3
Measure your goal for (#) closed deals.
($) Monthly Revenue Goal (MRG) / ($) Average Purchase Value = (#) Closed Deals Goal
STEP 4
Go backwards to measure the Pipeline Volume Goal for each stage.
(#) Closed Deal Goal / (#) Close Conv Rate =(#) Sales Qualified (SQL) Lead Vol Goal
(#) SQL Vol Goal / (#) MQL-SQL Conv Rate =(#) Marketing Qualified Lead (MQL) Vol Goal
Actions required:
- Send X cold emails
- Send X follow-up
- Make X calls
- Conduct X Demo
- Send X proposals
Prioritize your metrics
Not all metrics are necessary, so do a first test using most of KPIs highlighted in step 3 & 4 and then start focusing on 5-8 sales KPIs (both contextual metrics and action metrics).
- Contextual example: Weekly Sales $ to date vs target weekly sales $
- Activity example: X cold emails vs (#) sales qualified leads
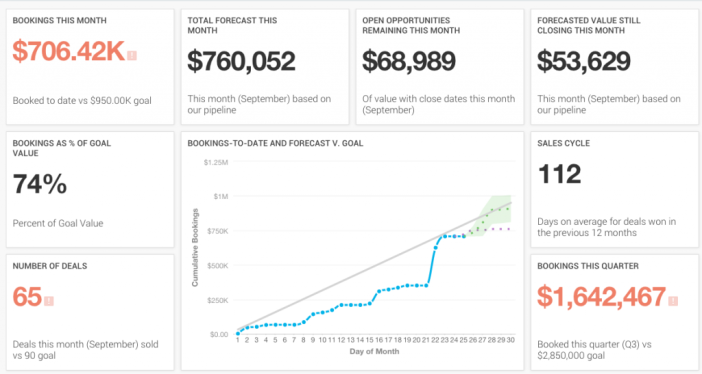
Here an example of dashboard used to analyze and inform in real time your sales team about their sales performance.
Usual Sales KPIs For Sales Executives:
- Monthly Sales Target ($)
- Marketing Qualified Lead (MQL) to Sales Qualified Lead(SQL) Conversion Rate
- Sales Qualified Lead (SQL) to Close Conversion Rate
- Sales growth vs goal
- (#) Deals closed vs goal
- Activity per rep vs Close per rep
- Average sales cycle
- Average follow-up attempts
Usual Sales KPIs For AE, BDR & SDR:
- Opportunity funnel
- Individual Monthly Sales Target ($)
- Lead response time
- (#) Qualified opportunities
- Individual Sales activity (# calls/emails/meetings) vs efficiency
- Value of closed deals this month ($) vs target